Double EMA CROSS
Double EMA CROSS (DEC)
Useful for identifying and receiving alerts about uptrends and downtrends.
This script uses two Exponential Moving Averages (EMAs) to find price uptrends and downtrends.
An Exponential Moving Average ( EMA ) is a type of moving average that places a greater weight and significance on the most recent data points.
The script produces uptrend and downtrend signals based on crossovers and divergences between the two EMAs,
the user will be able to spot a trend change (when the EMAs crossover) and to determine the strength of the current trend (when the EMAs diverge).
It is also posible to get alerts for uptrends and downtrends on the web and mobile app with sound and pop-ups as well as via email.
The optimal time to enter and exit the market can be concluded from this trend changes.
The user can set their own EMAs, by default they are set to 25 and 75 periods for medium and long term respectively.
When the medium term EMA crosses below the long term EMA the asset is in a downtrend and the price will decline, and when the
medium term EMA crosses above the long term EMA the asset is in an uptrend and price will increase.
This scripts plots the following indicators and signals on the chart to help the user to identify trends:
1.- Medium and long term EMAs as lines overlaid on the price chart.
2.- Up green triangles above bars when the price is on an uptrend and down red triangles below bars when the price is on a downtrend.
3.- Arrows with text to indicate the start of an uptrend or downtrend.
The user can enable and disable the indicators and signals as well as set colors and shapes to their liking.
This script also lets the user create alerts for uptrends and downtrends. To create a new alert using this script follow this instructions:
1.- Once you added this script to your chart, go to the alerts panel (right on web or bottom tool bar on the mobile app) and add a new alert (alarm clock icon with a plus sign).
2.- A modal window will open. On the “Condition” dropdown menu select “DEC”.
3.- On the next dropdown menu (right below the “Condition” one) you can select.
4.- Lastly you can set all the normal alert options and create the alert.
Cari dalam skrip untuk "3 ema"

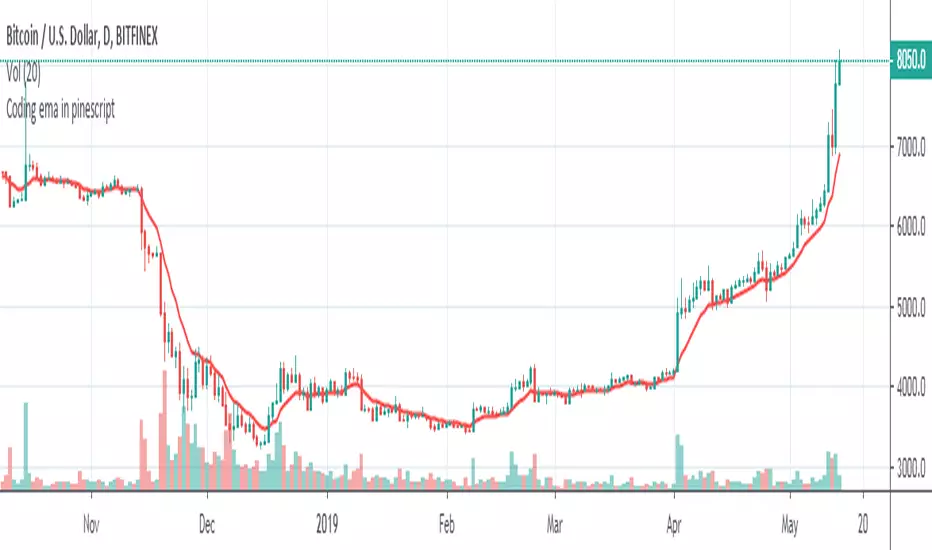
Coding ema in pinescriptWhat is EMA ?
Ema is known as exponential moving average, it comes from the class of weighted moving average. It gives more weightage to the recent price changes, thus making it much more relevant to the current market analysis. Also it provides a dynamic way of calculating support and resistances in a trend following setup.
The most common way to mint profit out from the market is to use trend following setups which can be easily achieved by using a group of EMA’s
So how’s this EMA calculated ?
Before understanding the calculation of EMA let’s look into a much wider topic:
“The Law of Averages”
It states : If you do something often enough a ratio will appear, simply put, any time series data, tend to deviate from its average.
EMA provides a way to statistically calculate the exponential moving average for a provided time series data giving much more emphasis on the most recent data in the series.
So in the 17th century, when the people were playing with numbers in their free time, they came up with a statistical strategy to envelop any time series data to detect the direction of the data flow , they called it exponential moving average.
Later in 1940’s with the increase in signal processing requirements in the field of electronic devices scientists started using Exponential moving average onto the electronic signal followers, just to classify the signals as above or below a moving/dynamic threshold.
So EMA is a smoothed time-series data.
The simplest form of EMA Smoothing can be given by the formula:
S(t) = alpha * X(t) + (1 - alpha) * X(t - 1).
The value of alpha must lie between 0 and 1
Where
alpha , is the smoothing factor
X(t) , is the current observation data point
X(t - 1), is the past observational data point.
t , is the current time
Generally,
In current day trading setups for EMA the alpha is calculated by
alpha = 2 / (time period window + 1)
Things to note here is that the alpha calculated above is the most generally used factor calculation method for EMA ,
You can tweak the alpha function above until it gives value between 0 and 1 for example alpha can also be written as
alpha = ln ( current price / past price )
Note it’s just a weighing scheme,
But for Our Case of EMA
We will be using
alpha = 2 / (time period window + 1)
Please refer to the script code below
Alper-EMAAlper-EMA
Description:
This indicator allows you to display 5 customizable EMAs (Exponential Moving Averages) on a single chart. Each EMA can be configured independently with length, color, visibility, and calculation timeframe.
Features:
5 fully customizable EMAs
Set individual length and color for each EMA
Toggle visibility for each EMA
Multi-timeframe calculation: e.g., display EMA300 calculated on a 30-minute timeframe while viewing a 1-minute chart
Labels display EMA period and timeframe for clarity
Adjustable label size: tiny / small / normal / large
Clear and readable plot lines
Use Cases:
Monitor multiple timeframe EMAs simultaneously
Analyze trend and support/resistance levels
Track EMA crossovers for strategy development
Note:
This indicator is suitable for both short-term (scalping) and medium-to-long term analysis. The multi-timeframe feature allows you to see different EMA perspectives on a single chart quickly.

Daily 12/21 EMA OverlayDaily 12/21 EMA Overlay
This indicator projects the daily 12 and 21 EMAs onto any timeframe as a soft, semi-transparent band. It is designed to give a constant higher-timeframe bias and dynamic support/resistance reference while you execute your systems on lower timeframes (4H, 1H, 15m, etc.).
The script uses request.security() to calculate the 12/21 EMAs on the daily chart only, then overlays those values on your current timeframe without recalculating them locally. This means the band always represents the true daily 12/21 EMAs, regardless of the chart you are viewing.
Key Features:
Fixed daily 12/21 EMA band, visible on all timeframes
Faded lines and fill to keep focus on your active intraday tools
Simple, minimal inputs (fast length, slow length, colors, band visibility)
Ideal as a higher-timeframe “backdrop” for systems built around EMA trend, rejections, or liquidity sweeps
How to Use
Add the indicator on any symbol and timeframe
Keep your normal intraday EMAs (e.g., EMA 12/21) for execution
Note: You can change the bands to not just be 12 or 21, you can change them if needed for your own systems or emas that you use.
This tool is intentionally lightweight: it does one job—showing the true daily EMA structure across all timeframes—and leaves trade execution logic to your primary system.

W%R Pullback+EMA Trend [TS_Indie]🔰 Core Concept of the Strategy
The main idea is “Trend-Following with Momentum Pullback.”
This means trading in the direction of the main trend (defined by EMA) while using Williams %R to identify pullback entries (buying the dip or selling the rally) where momentum returns to the trend direction.
📊 Indicators Used
1. EMA Fast – Defines the short-term trend.
2. EMA Slow – Defines the long-term trend (used as a trend filter).
3. Williams %R
• Overbought zone: above -20
• Oversold zone: below -80
⚙️ Entry Rules
🔹 Buy Setup
1. EMA Fast > EMA Slow → Uptrend condition.
2. Williams %R on the previous candle dropped below -80, and on the current candle, it crosses back above -80 → indicates momentum returning to the upside.
3. Current close is above EMA Fast.
4. Entry Buy at the close of the candle where %R crosses above -80.
🎯 Entry, Stop Loss, and Take Profit
1. Entry : At the candle close where the signal occurs.
2. Stop Loss : At the lowest low between the current and previous candles.
3. Take Profit : Calculated based on entry price and stop loss distance multiplied by the Risk/Reward Ratio.
🔹 Sell Setup
1. EMA Fast < EMA Slow → Downtrend condition.
2. Williams %R on the previous candle went above -20, and on the current candle, it crosses back below -20 → indicates renewed selling momentum.
3. Current price is below EMA Fast.
4. Entry Sell at the close of the candle where %R crosses below -20.
🎯 Entry, Stop Loss, and Take Profit
1. Entry : At the candle close where the signal occurs.
2. Stop Loss : At the highest high between the current and previous candles.
3. Take Profit : Calculated based on entry price and stop loss distance multiplied by the Risk/Reward Ratio.
⚙️ Optional Parameters
• Custom Risk/Reward Ratio for Take Profit.
• Option to add ATR buffer to Stop Loss.
• Adjustable EMA Fast period.
• Adjustable EMA Slow period.
• Adjustable Williams %R period.
• Option to enable Long only / Short only positions.
• Customizable Backtest start and end date.
• Customizable trading session time.
⏰ Alert Function
Alerts display:
• Entry price
• Stop Loss price
• Take Profit price
Guys, try adjusting the parameters yourselves!
I’ve been tweaking the settings for several days and managed to get great results on XAU/USD in the 5-minute timeframe.
I think this strategy is quite interesting and could potentially deliver good results on other instruments as well.
⚠️ Disclaimer
This indicator is designed for educational and research purposes only.
It does not guarantee profits and should not be considered financial advice.
Trading in financial markets involves significant risk, including the potential loss of capital.

Stoch PRO + Dynamic EMA (EMA cross)Stoch PRO + Dynamic EMA Documentation
Overview:
- Pine Script v6 overlay indicator combining a trend-colored EMA with a Stochastic oscillator to highlight midline momentum shifts.
- Designed for TradingView charts (Indicators → Import) as a visual aid for timing entries within trend-following setups.
- Crafted and optimized around BTCUSDT on the 4h timeframe; adapt inputs before applying to other markets or intervals.
Inputs:
- EMA Length (default 50): smoothing window for the dynamic EMA; lower values respond faster but whipsaw more.
- Stochastic K Length (20): lookback for the raw %K calculation.
- Stochastic K Smoothing (3): SMA applied to %K to reduce noise.
- Stochastic D Smoothing (3): SMA over %K to produce the companion %D line.
Visual Elements:
- EMA plotted on price with linewidth 3; teal when close > EMA, fuchsia otherwise.
- Background tinted teal/fuchsia at high transparency (≈92) to reinforce the current trend bias without obscuring price bars.
Oscillator Logic:
- %K = ta.stoch(high, low, close, kLength); smoothed with ta.sma(kRaw, kSmooth).
- %D = ta.sma(k, dSmooth).
- Focus is on the midline (50) rather than traditional 20/80 extremes to emphasize rapid momentum flips.
Signals:
- Buy: %K crossing above 50 while close > EMA (teal state). Plots tiny teal circle below the bar.
- Sell: %K crossing below 50 while close < EMA (fuchsia state). Plots tiny purple circle above the bar.
Trading Workflow Tips:
- Use EMA/background color for directional bias, then confirm with %K 50-cross to refine entries.
- Consider higher-timeframe trend filters or price-action confirmation to avoid range chop.
- Stops often sit just beyond the EMA; adjust thresholds (e.g., 55/45) if too many false positives occur.
- Always plan risk/reward upfront—define TP/SL levels that fit your strategy and backtest them thoroughly before trading live.
Alerts & Extensions:
- Wrap crossUp/crossDown in alertcondition() if TradingView alerts are needed.
- For automation/backtesting, convert logic to a strategy() script or add position management rules.

Dual EMA Trend Ribbon (Multi-Timeframe Trend Confirmation) Dual EMA Trend Ribbon (Multi-Timeframe Trend Confirmation)
This Pine Script indicator creates a visually clear representation of trend direction using two overlaid Exponential Moving Average (EMA) Ribbons, which allows traders to assess both short-term and medium-term momentum at a glance.
How It Works:
The indicator plots two separate EMA ribbons, each calculated using a distinct set of periods, simulating a multi-timeframe approach on a single chart:
Inner (Fast) Ribbon (Defaults 10/30): Represents the fast-moving, short-term trend.
Green: Fast EMA 1 > Slow EMA 1 (Short-term Bullish)
Red: Fast EMA 1 < Slow EMA 1 (Short-term Bearish)
Outer (Slow) Ribbon (Defaults 40/50): Represents the slower, medium-term trend.
Darker Green/Red: Indicates the overall, underlying market bias.
How to Use:
Strong Trend Confirmation: A strong signal occurs when both ribbons are aligned (e.g., both are Green). This suggests that short-term momentum aligns with the medium-term bias.
Trend Weakness/Reversal: Pay attention when the two ribbons cross or when the fast ribbon changes color against the slow ribbon's color (e.g., fast ribbon turns Red while the slow ribbon remains Green). This often signals a temporary pullback or potential reversal of the underlying trend.
Settings: Users can easily adjust the four input periods (Fast EMA 1, Slow EMA 1, Fast EMA 2, Slow EMA 2) to customize the sensitivity to any trading style or asset.
Stalonte EMA - Stable Long-Term EMA with AlertsStalonte EMA - The Adaptive & Stable EMA - Almost Eternal
Here's why you will love "Stalonte":
The Stalonte (Stable Long-Term EMA) is a highly versatile trend-following tool. Unlike standard EMAs with fixed periods, it uses a configurable smoothing constant (alpha), allowing traders to dial in the exact level of responsiveness and stability they need. Finding the "sweet spot" (e.g., alpha ~0.03) creates a uniquely effective moving average: it is smooth enough to filter out noise and identify safe, high-probability trends, yet responsive enough to provide actionable signals without extreme lag. It includes alerts for crossovers and retests.
Pros and Cons of the Stalonte EMA
Pros:
Unparalleled Adaptability: This is its greatest strength. The alpha input lets you seamlessly transform the indicator from an ultra-slow "trend-revealer" (low alpha) into a highly effective and "safe" trend-following tool (medium alpha, e.g., 0.03), all the way to a more reactive one.
Optimized for Safety & Signal Quality: As you astutely pointed out, with the proper setting (like 0.03), it finds the perfect balance. It provides a smoother path than a standard 20-50 period EMA, which reduces whipsaws and false breakouts, leading to safer, higher-confidence signals.
Superior Trend Visualization: It gives a cleaner and more intuitive representation of the market's direction than many conventional moving averages, making it easier to "see" the trend and stick with it.
Objective Dynamic Support/Resistance: The line created with a medium alpha setting acts as a powerful dynamic support in uptrends and resistance in downtrends, offering excellent areas for entries on retests with integrated alerts.
Cons:
Requires Calibration: The only "con" is that its performance is not plug-and-play; it requires the user to find their optimal alpha value for their specific trading style and the instrument they are trading. This demands a period of testing and customization, which a standard 50-period EMA does not.
Conceptual Hurdle: For traders only familiar with period-based EMAs, the concept of a "smoothing constant" can be initially confusing compared to simply setting a "length."
In summary:
The Stalonte EMA is not a laggy relic. It is a highly sophisticated and adaptable tool. Its design allows for precise tuning, enabling a trader to discover a setting that offers a superior blend of stability and responsiveness—a "sweet spot" that provides safer and often more effective signals than many traditional moving averages. Thank you for pushing for a more accurate and fair assessment.
Use Case Example:
You can combine it with classical EMAs to find the perfect entry.
Smoothed EMA LinesThe "Smoothed EMA Lines" script is a technical analysis tool designed to help traders identify trends and potential support/resistance levels in financial markets. The script plots exponential moving averages (EMAs) of the closing price for five commonly used time periods: 8, 13, 21, 55, and 200.
Key features of the script include:
Overlay: The EMAs are plotted directly on the price chart, making it easy to analyze the relationship between the moving averages and price action.
Smoothing: The script applies an additional smoothing function to each EMA, using a simple moving average (SMA) of a user-defined length. This helps to reduce noise and provide a clearer picture of the trend.
Customizable lengths: Users can easily adjust the length of each EMA and the smoothing period through the script's input parameters.
Color-coded plots: Each EMA is assigned a unique color (8: blue, 13: green, 21: orange, 55: red, 200: purple) for easy identification on the chart.
Traders can use the "Smoothed EMA Lines" script to:
Identify the overall trend direction (bullish, bearish, or neutral) based on the arrangement of the EMAs.
Spot potential support and resistance levels where the price may interact with the EMAs.
Look for crossovers between EMAs as potential entry or exit signals.
Combine the EMA analysis with other technical indicators and price action patterns for a more comprehensive trading strategy.
The "Smoothed EMA Lines" script provides a clear, customizable, and easy-to-interpret visualization of key exponential moving averages, helping traders make informed decisions based on trend analysis.

Price Above 50 and 200 EMA with Smiley faces and 200 ema slope
Overview
This advanced indicator provides a comprehensive multi-timeframe analysis of price positioning relative to 50 and 200 Exponential Moving Averages (EMAs), offering traders a quick and intuitive view of market trends across different timeframes.
Key Features
Multi-Timeframe Analysis: Simultaneously evaluates price behavior across 5m, 15m, and other selected timeframes
EMA Trend Visualization: Instantly shows whether price is above or below 50 and 200 EMAs
Slope Direction Indicator: Tracks the directional momentum of the 200 EMA
Customizable Distance Metrics: Option to display distances as absolute values or percentages
Emoji-Based Indicators: Quick visual representation of price positioning
Functionality
The indicator uses color-coded and emoji-based signals to represent:
😊 (Blue): Price is above the EMA
☹️ (Red): Price is below the EMA
⬆️ (Blue): EMA slope is positive
⬇️ (Red): EMA slope is negative
Customization Options
Adjustable EMA periods
Togglable distance display
Distance representation (percentage or absolute value)
Best Used For
Trend identification
Multi-timeframe analysis
Quick market sentiment assessment
Supplementing other technical analysis tools
Recommended Timeframes
Intraday trading
Swing trading
Trend following strategies
Risk Disclaimer
This indicator is a tool for analysis and should not be used in isolation for trading decisions. Always combine with other technical and fundamental analysis, and proper risk management.
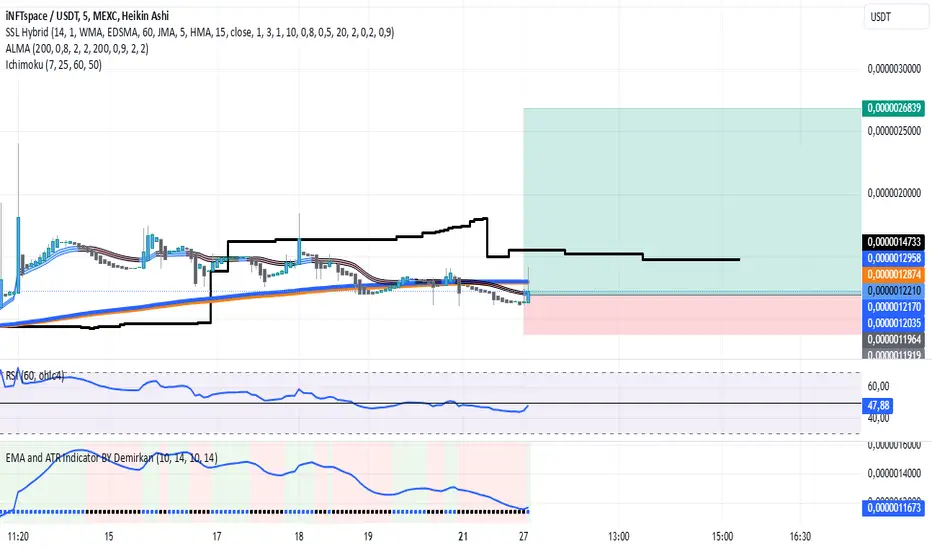
EMA and ATR Indicator BY DemirkanEMA 10 and ATR Indicator BY Demirkan
The EMA 10 and ATR Indicator combines two powerful technical indicators used to analyze trends and identify potential trading opportunities.
Indicator Components:
Exponential Moving Average (EMA):
EMA 10: Calculates the weighted average of the last 10 closing prices. This indicator is effective in tracking short-term price movements. When the price is above the EMA, it is considered that the trend is upward; when it is below, it is assessed as a downward trend.
Average True Range (ATR):
ATR: A measure of market volatility. When the ATR value falls within a specified range (between 10 and 14 in this indicator), the price movement is considered significant. This helps you base your trading decisions on more solid grounds.
Usage Recommendations:
Buy Signal: When the price is above the EMA and the ATR is within the specified range, this can be interpreted as a potential buy signal.
Sell Signal: When the price is below the EMA, this can be interpreted as a potential sell signal.
Chart Displays:
EMA Line: Displayed as a blue line, allowing you to see how the EMA relates to current price levels.
Price Status: Circles are used to indicate whether the price is above or below the EMA. A green circle indicates the price is above the EMA, while a red circle indicates it is below.
Background Colors: The chart background changes to green or red to highlight buy and sell conditions.
Aesthetic Presentation:
Using the "Flag" and "Below" parameters for the Price vs EMA indicator provides an aesthetically pleasing appearance on the chart. This type of visual presentation helps users quickly and easily grasp trading signals. Additionally, this aesthetic touch makes investors' charts look more professional and appealing.
This indicator is a useful tool for traders looking to develop short-term trading strategies. However, it should always be used in conjunction with additional analysis and other indicators.
Note: This indicator is for educational purposes only and should not be taken as investment advice.
LRS-Strategy: 200-EMA Buffer & Long/Short Signals LRS-Strategy: 200-EMA Buffer & Long/Short Signals
This indicator is designed to help traders implement the Leveraged Return Strategy (LRS) using the 200-day Exponential Moving Average (EMA) as a key trend-following signal. The indicator offers clear long and short signals by analyzing the price movements relative to the 200-day EMA, enhanced by customizable buffer zones for increased precision.
Key Features:
200-Day EMA: The main trend indicator. When the price is above the 200-day EMA, the market is considered in an uptrend, and when it is below, it indicates a downtrend.
Customizable Buffer Zones: Users can define a percentage buffer around the 200-day EMA (default is 3%). The upper and lower buffer zones help filter out noise and prevent premature signals.
Precise Long/Short Signals:
Long Signal: Triggered when the price moves from below the lower buffer zone, crosses the 200-day EMA, and then breaks above the upper buffer zone.
Short Signal: Triggered when the price moves from above the upper buffer zone, crosses the 200-day EMA, and then breaks below the lower buffer zone.
Alternating Signals: Ensures that a new signal (long or short) is only generated after the opposite signal has been triggered, preventing multiple signals of the same type without a reversal.
Clear Visual Aids: The indicator displays the 200-day EMA and buffer zones on the chart, along with buy (long) and sell (short) signals. This makes it easy to track trends and time entries/exits.
How to Use:
Long Entry: Look for the price to move below the lower buffer, cross the 200-day EMA from below, and then break out of the upper buffer to confirm a long signal.
Short Entry: Look for the price to move above the upper buffer, cross below the 200-day EMA, and then break below the lower buffer to confirm a short signal.
This indicator is perfect for traders who prefer a structured, trend-following approach, using clear rules to minimize noise and identify meaningful long or short opportunities.

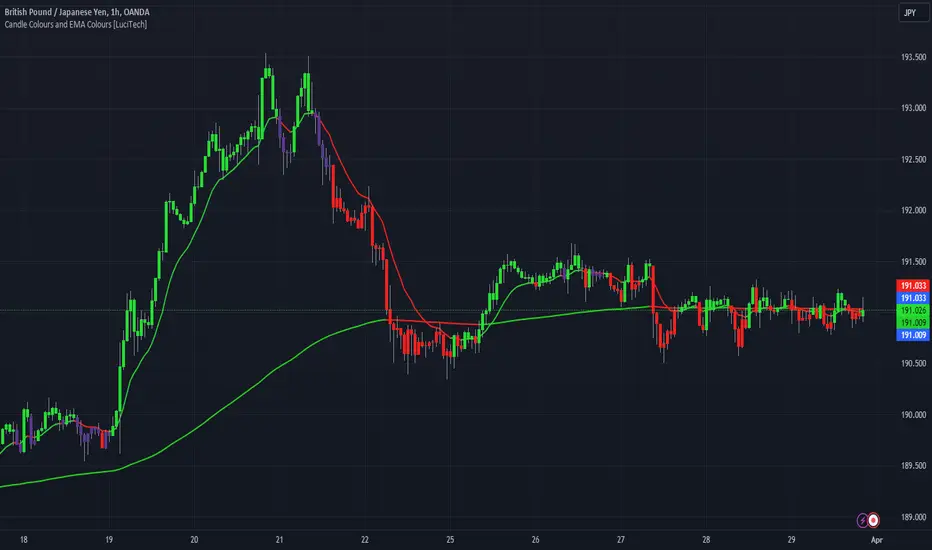
Candle Colours and EMA Colours [LuciTech]this indicator assigns a colour to each candle based on the relationship between the price and the EMAs, The indicator first checks whether the close price is above or below the first EMA, If the close price is above the first EMA the candle is coloured green. If the close price inbetween both EMAs the candle is colored gray. If the close price is below the second EMA, the candle is coloured red.
the indicator also colours the EMAs based on the closed price, if closed price is above the EMAs its coloured green and if price is closed below the EMA is coloured red.
The colours of the candles and EMAs can be changed in "style" and the periods of the EMAs can be changed in inputs.
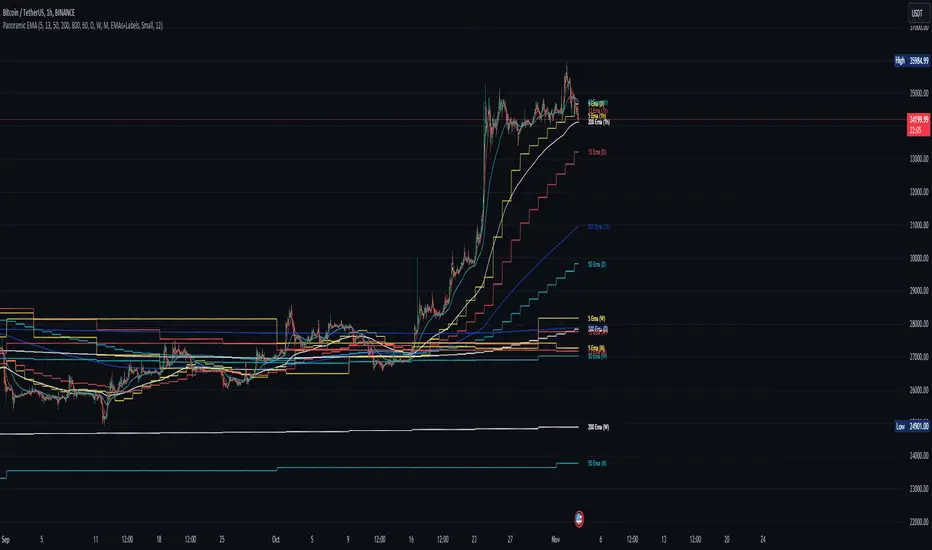
Panoramic EMA - Multi TimeframePanoramic EMA - Multi Timeframe
This indicator provides a straightforward visualization of Exponential Moving Averages (EMAs) from multiple timeframes simultaneously. This indicator allows traders to customize the display of EMAs, making it easier to identify and analyze trends and potential support or resistance levels across different periods.
Settings:
EMA Lengths: Customize up to five EMA lengths. Activating a length will display its EMA line on the chart for the selected timeframes.
Timeframes Selection: Choose up to four different timeframes to display the EMAs. This lets you observe how EMAs behave on various scales from a single chart.
Interpretation:
Utilize the EMAs as potential zones of dynamic support or resistance.
Observe the relationship between price action and EMAs across different timeframes to gauge market sentiment and identify trend consistency or potential shifts.
This tool is designed to offer visual clues about the market state through the behavior of EMAs. It does not generate direct buy or sell signals. It is recommended to understand how the assets you are trading interact with EMAs. For instance, in our example below, Bitcoin demonstrates a tendency to interact with the 800 and 200-length EMAs on the 4-hour timeframe, providing areas where price rejections may occur:
Note: This is a utility-focused indicator meant to supplement your market analysis and should be used in conjunction with other analysis methods or indicators for the best results.
[FC] Multi EMA Cross Alerts Fltered with RSI and StochThis script prints Green Dots and Red Dots on candle close using Faster EMA ( 5 ) and Slower EMA (10 ) filtering with RSI (50)+ Stochastic %K ( 20 to 80 ) Smoothning(3).
The idea behind is to you use dots for scalping on smaller timeframe(5) ,(10) etc but you can modify all values to better fit your needs.
Explaination for Green Dots and Red Dots:
---> Green dot : 5 Ema crosses above 10 Ema ( i.e faster EMA crosses above slower EMA which signals price is trying to move up
RSI value > 50 (filtering for quick move)
stoch %k value between 20 and 80 ( filtering to know there is leg left in the move and all movement is already not done)
---> Red dot : 5 Ema crosses below 10 Ema ( i.e faster EMA crosses above slower EMA which signals price is trying to move down
RSI value < 50 (filtering for quick move)
stoch %k value between 20 and 80 ( filtering to know there is leg left in the move and all movement is already not done)

3 Fib EMAs To Scalp Them AllThe "3 Fib EMAs To Scalp Them All" was made in order to clear up when we should look for shorts, longs, or walk away. Also it can alert you when a trend starts, or when there is a possible reversal. I use it for scalping/day trading in 5m-1h timeframes.
1. EMAs: By default, the indicator uses Fibonacci numbers (21, 55, 233), but you can change them.
2. Color Changes: The color of the Micro EMA line changes depending on its relation to the Mid and Macro EMAs.
When Micro EMA < Mid < Macro EMA, it turns red, indicating a potential bearish trend - that's when you should look for shorts
When Micro EMA > Mid > Macro EMA, it turns green, indicating a potential bullish trend - that's when you should look for longs
A white Micro EMA is when you need to take some rest, enjoy your coffee, and avoid overtrading.
3. Signals: The indicator provides visual signals in the form of diamonds and crosses and corresponding alert signals.
A red diamond above the bar signals a potential beginning of a downtrend
A red cross above the bar signals the end of the downtrend and can be used as a signal for a possible reversal up/breakout.
A green diamond below the bar signals a potential beginning of a downtrend,
A green cross below the bar signals the end of the uptrend and can be used as a signal for a possible reversal down/breakout.
4. Alerts: For algo traders and people who prefer to stay away from the monitor... there are alerts for every signal.
Friendly note: Don't blindly follow the signals for your long and short entries. The signals only pop up when the EMA cross value gets a confirmation. A smart move would be to wait for a retracement to the EMA line and use momentum indicators like market cipher B to pinpoint those ideal entry points.

4-Way EMA Trend4 separate EMAs that are used to determine trend, colored appropriately to reflect the trend to make it easy to tell what the trend is. All 4 EMAs are not needed, you can turn each one on and off individually and the indicator will adjust itself accordingly. Having a single EMA will use the closing price to determine the trend. There are 2 different types of trend detection; EMA Flip and EMA Confluence. EMA Flip is dependent on all active EMAs rising or falling in the correct hierarchical order. The EMA Confluence option is if all EMAs are moving in the same direction. I've found that this second option, EMA Confluence, is more accurate in getting in early before strong movements because the EMAs will more often move in the same direction before they "flip".

Triple EMA Scalper low lag stratHi all,
This strategy is based on the Amazing scalper for majors with risk management by SoftKill21
The change is in lines 11-20 where the sma's are replaced with Triple ema's to
lower the lag.
The original author is SoftKill21. His explanation is repeated below:
Best suited for 1M time frame and majors currency pairs.
Note that I tried it at 3M time frame.
Its made of :
Ema ( exponential moving average ) , long period 25
Ema ( exponential moving average ) Predictive, long period 50,
Ema ( exponential moving average ) Predictive, long period 100
Risk management , risking % of equity per trade using stop loss and take profits levels.
Long Entry:
When the Ema 25 cross up through the 50 Ema and 100 EMA . and we are in london or new york session( very important the session, imagine if we have only american or european currencies, its best to test it)
Short Entry:
When the Ema 25 cross down through the 50 Ema and 100 EMA , and we are in london or new york session( very important the session, imagine if we have only american or european currencies, its best to test it)
Exit:
TargetPrice: 5-10 pips
Stop loss: 9-12 pips

Price Action and 3 EMAs Momentum plus Sessions FilterThis indicator plots on the chart the parameters and signals of the Price Action and 3 EMAs Momentum plus Sessions Filter Algorithmic Strategy. The strategy trades based on time-series (absolute) and relative momentum of price close, highs, lows and 3 EMAs.
I am still learning PS and therefore I have only been able to write the indicator up to the Signal generation. I plan to expand the indicator to Entry Signals as well as the full Strategy.
The strategy works best on EURUSD in the 15 minutes TF during London and New York sessions with 1 to 1 TP and SL of 30 pips with lots resulting in 3% risk of the account per trade. I have already written the full strategy in another language and platform and back tested it for ten years and it was profitable for 7 of the 10 years with average profit of 15% p.a which can be easily increased by increasing risk per trade. I have been trading it live in that platform for over two years and it is profitable.
Contributions from experienced PS coders in completing the Indicator as well as writing the Strategy and back testing it on Trading View will be appreciated.
STRATEGY AND INDICATOR PARAMETERS
Three periods of 12, 48 and 96 in the 15 min TF which are equivalent to 3, 12 and 24 hours i.e (15 min * period / 60 min) are the foundational inputs for all the parameters of the PA & 3 EMAs Momentum + SF Algo Strategy and its Indicator.
3 EMAs momentum parameters and conditions
• FastEMA = ema of 12 periods
• MedEMA = ema of 48 periods
• SlowEMA = ema of 96 periods
• All the EMAs analyse price close for up to 96 (15 min periods) equivalent to 24 hours
• There’s Upward EMA momentum if price close > FastEMA and FastEMA > MedEMA and MedEMA > SlowEMA
• There’s Downward EMA momentum if price close < FastEMA and FastEMA < MedEMA and MedEMA < SlowEMA
PA momentum parameters and conditions
• HH = Highest High of 48 periods from 1st closed bar before current bar
• LL = Lowest Low of 48 periods from 1st closed bar from current bar
• Previous HH = Highest High of 84 periods from 12th closed bar before current bar
• Previous LL = Lowest Low of 84 periods from 12th closed bar before current bar
• All the HH & LL and prevHH & prevLL are within the 96 periods from the 1st closed bar before current bar and therefore indicative of momentum during the past 24 hours
• There’s Upward PA momentum if price close > HH and HH > prevHH and LL > prevLL
• There’s Downward PA momentum if price close < LL and LL < prevLL and HH < prevHH
Signal conditions and Status (BuySignal, SellSignal or Neutral)
• The strategy generates Buy or Sell Signals if both 3 EMAs and PA momentum conditions are met for each direction and these occur during the London and New York sessions
• BuySignal if price close > FastEMA and FastEMA > MedEMA and MedEMA > SlowEMA and price close > HH and HH > prevHH and LL > prevLL and timeinrange (LDN&NY) else Neutral
• SellSignal if price close < FastEMA and FastEMA < MedEMA and MedEMA < SlowEMA and price close < LL and LL < prevLL and HH < prevHH and timeinrange (LDN&NY) else Neutral
Entry conditions and Status (EnterBuy, EnterSell or Neutral)(NOT CODED YET)
• ENTRY IS NOT AT THE SIGNAL BAR but at the current bar tick price retracement to FastEMA after the signal
• EnterBuy if current bar tick price <= FastEMA and current bar tick price > prevHH at the time of the Buy Signal
• EnterSell if current bar tick price >= FastEMA and current bar tick price > prevLL at the time of the Sell Signal

Naveen Prabhu with EMA//@version=6
indicator('Naveen Prabhu with EMA', overlay = true, max_labels_count = 500, max_lines_count = 500, max_boxes_count = 500)
a = input(2, title = 'Key Vaule. \'This changes the sensitivity\'')
c = input(5, title = 'ATR Period')
h = input(false, title = 'Signals from Heikin Ashi Candles')
BULLISH_LEG = 1
BEARISH_LEG = 0
BULLISH = +1
BEARISH = -1
GREEN = #089981
RED = #F23645
BLUE = #2157f3
GRAY = #878b94
MONO_BULLISH = #b2b5be
MONO_BEARISH = #5d606b
HISTORICAL = 'Historical'
PRESENT = 'Present'
COLORED = 'Colored'
MONOCHROME = 'Monochrome'
ALL = 'All'
BOS = 'BOS'
CHOCH = 'CHoCH'
TINY = size.tiny
SMALL = size.small
NORMAL = size.normal
ATR = 'Atr'
RANGE = 'Cumulative Mean Range'
CLOSE = 'Close'
HIGHLOW = 'High/Low'
SOLID = '⎯⎯⎯'
DASHED = '----'
DOTTED = '····'
SMART_GROUP = 'Smart Money Concepts'
INTERNAL_GROUP = 'Real Time Internal Structure'
SWING_GROUP = 'Real Time Swing Structure'
BLOCKS_GROUP = 'Order Blocks'
EQUAL_GROUP = 'EQH/EQL'
GAPS_GROUP = 'Fair Value Gaps'
LEVELS_GROUP = 'Highs & Lows MTF'
ZONES_GROUP = 'Premium & Discount Zones'
modeTooltip = 'Allows to display historical Structure or only the recent ones'
styleTooltip = 'Indicator color theme'
showTrendTooltip = 'Display additional candles with a color reflecting the current trend detected by structure'
showInternalsTooltip = 'Display internal market structure'
internalFilterConfluenceTooltip = 'Filter non significant internal structure breakouts'
showStructureTooltip = 'Display swing market Structure'
showSwingsTooltip = 'Display swing point as labels on the chart'
showHighLowSwingsTooltip = 'Highlight most recent strong and weak high/low points on the chart'
showInternalOrderBlocksTooltip = 'Display internal order blocks on the chart\n\nNumber of internal order blocks to display on the chart'
showSwingOrderBlocksTooltip = 'Display swing order blocks on the chart\n\nNumber of internal swing blocks to display on the chart'
orderBlockFilterTooltip = 'Method used to filter out volatile order blocks \n\nIt is recommended to use the cumulative mean range method when a low amount of data is available'
orderBlockMitigationTooltip = 'Select what values to use for order block mitigation'
showEqualHighsLowsTooltip = 'Display equal highs and equal lows on the chart'
equalHighsLowsLengthTooltip = 'Number of bars used to confirm equal highs and equal lows'
equalHighsLowsThresholdTooltip = 'Sensitivity threshold in a range (0, 1) used for the detection of equal highs & lows\n\nLower values will return fewer but more pertinent results'
showFairValueGapsTooltip = 'Display fair values gaps on the chart'
fairValueGapsThresholdTooltip = 'Filter out non significant fair value gaps'
fairValueGapsTimeframeTooltip = 'Fair value gaps timeframe'
fairValueGapsExtendTooltip = 'Determine how many bars to extend the Fair Value Gap boxes on chart'
showPremiumDiscountZonesTooltip = 'Display premium, discount, and equilibrium zones on chart'
modeInput = input.string( HISTORICAL, 'Mode', group = SMART_GROUP, tooltip = modeTooltip, options = )
styleInput = input.string( COLORED, 'Style', group = SMART_GROUP, tooltip = styleTooltip,options = )
showTrendInput = input( false, 'Color Candles', group = SMART_GROUP, tooltip = showTrendTooltip)
showInternalsInput = input( false, 'Show Internal Structure', group = INTERNAL_GROUP, tooltip = showInternalsTooltip)
showInternalBullInput = input.string( ALL, 'Bullish Structure', group = INTERNAL_GROUP, inline = 'ibull', options = )
internalBullColorInput = input( GREEN, '', group = INTERNAL_GROUP, inline = 'ibull')
showInternalBearInput = input.string( ALL, 'Bearish Structure' , group = INTERNAL_GROUP, inline = 'ibear', options = )
internalBearColorInput = input( RED, '', group = INTERNAL_GROUP, inline = 'ibear')
internalFilterConfluenceInput = input( false, 'Confluence Filter', group = INTERNAL_GROUP, tooltip = internalFilterConfluenceTooltip)
internalStructureSize = input.string( TINY, 'Internal Label Size', group = INTERNAL_GROUP, options = )
showStructureInput = input( false, 'Show Swing Structure', group = SWING_GROUP, tooltip = showStructureTooltip)
showSwingBullInput = input.string( ALL, 'Bullish Structure', group = SWING_GROUP, inline = 'bull', options = )
swingBullColorInput = input( GREEN, '', group = SWING_GROUP, inline = 'bull')
showSwingBearInput = input.string( ALL, 'Bearish Structure', group = SWING_GROUP, inline = 'bear', options = )
swingBearColorInput = input( RED, '', group = SWING_GROUP, inline = 'bear')
swingStructureSize = input.string( SMALL, 'Swing Label Size', group = SWING_GROUP, options = )
showSwingsInput = input( false, 'Show Swings Points', group = SWING_GROUP, tooltip = showSwingsTooltip,inline = 'swings')
swingsLengthInput = input.int( 50, '', group = SWING_GROUP, minval = 10, inline = 'swings')
showHighLowSwingsInput = input( false, 'Show Strong/Weak High/Low',group = SWING_GROUP, tooltip = showHighLowSwingsTooltip)
showInternalOrderBlocksInput = input( true, 'Internal Order Blocks' , group = BLOCKS_GROUP, tooltip = showInternalOrderBlocksTooltip, inline = 'iob')
internalOrderBlocksSizeInput = input.int( 5, '', group = BLOCKS_GROUP, minval = 1, maxval = 20, inline = 'iob')
showSwingOrderBlocksInput = input( true, 'Swing Order Blocks', group = BLOCKS_GROUP, tooltip = showSwingOrderBlocksTooltip, inline = 'ob')
swingOrderBlocksSizeInput = input.int( 5, '', group = BLOCKS_GROUP, minval = 1, maxval = 20, inline = 'ob')
orderBlockFilterInput = input.string( 'Atr', 'Order Block Filter', group = BLOCKS_GROUP, tooltip = orderBlockFilterTooltip, options = )
orderBlockMitigationInput = input.string( HIGHLOW, 'Order Block Mitigation', group = BLOCKS_GROUP, tooltip = orderBlockMitigationTooltip, options = )
internalBullishOrderBlockColor = input.color(color.new(GREEN, 80), 'Internal Bullish OB', group = BLOCKS_GROUP)
internalBearishOrderBlockColor = input.color(color.new(#f77c80, 80), 'Internal Bearish OB', group = BLOCKS_GROUP)
swingBullishOrderBlockColor = input.color(color.new(GREEN, 80), 'Bullish OB', group = BLOCKS_GROUP)
swingBearishOrderBlockColor = input.color(color.new(#b22833, 80), 'Bearish OB', group = BLOCKS_GROUP)
showEqualHighsLowsInput = input( false, 'Equal High/Low', group = EQUAL_GROUP, tooltip = showEqualHighsLowsTooltip)
equalHighsLowsLengthInput = input.int( 3, 'Bars Confirmation', group = EQUAL_GROUP, tooltip = equalHighsLowsLengthTooltip, minval = 1)
equalHighsLowsThresholdInput = input.float( 0.1, 'Threshold', group = EQUAL_GROUP, tooltip = equalHighsLowsThresholdTooltip, minval = 0, maxval = 0.5, step = 0.1)
equalHighsLowsSizeInput = input.string( TINY, 'Label Size', group = EQUAL_GROUP, options = )
showFairValueGapsInput = input( false, 'Fair Value Gaps', group = GAPS_GROUP, tooltip = showFairValueGapsTooltip)
fairValueGapsThresholdInput = input( true, 'Auto Threshold', group = GAPS_GROUP, tooltip = fairValueGapsThresholdTooltip)
fairValueGapsTimeframeInput = input.timeframe('', 'Timeframe', group = GAPS_GROUP, tooltip = fairValueGapsTimeframeTooltip)
fairValueGapsBullColorInput = input.color(color.new(#00ff68, 70), 'Bullish FVG' , group = GAPS_GROUP)
fairValueGapsBearColorInput = input.color(color.new(#ff0008, 70), 'Bearish FVG' , group = GAPS_GROUP)
fairValueGapsExtendInput = input.int( 1, 'Extend FVG', group = GAPS_GROUP, tooltip = fairValueGapsExtendTooltip, minval = 0)
showDailyLevelsInput = input( false, 'Daily', group = LEVELS_GROUP, inline = 'daily')
dailyLevelsStyleInput = input.string( SOLID, '', group = LEVELS_GROUP, inline = 'daily', options = )
dailyLevelsColorInput = input( BLUE, '', group = LEVELS_GROUP, inline = 'daily')
showWeeklyLevelsInput = input( false, 'Weekly', group = LEVELS_GROUP, inline = 'weekly')
weeklyLevelsStyleInput = input.string( SOLID, '', group = LEVELS_GROUP, inline = 'weekly', options = )
weeklyLevelsColorInput = input( BLUE, '', group = LEVELS_GROUP, inline = 'weekly')
showMonthlyLevelsInput = input( false, 'Monthly', group = LEVELS_GROUP, inline = 'monthly')
monthlyLevelsStyleInput = input.string( SOLID, '', group = LEVELS_GROUP, inline = 'monthly', options = )
monthlyLevelsColorInput = input( BLUE, '', group = LEVELS_GROUP, inline = 'monthly')
showPremiumDiscountZonesInput = input( false, 'Premium/Discount Zones', group = ZONES_GROUP , tooltip = showPremiumDiscountZonesTooltip)
premiumZoneColorInput = input.color( RED, 'Premium Zone', group = ZONES_GROUP)
equilibriumZoneColorInput = input.color( GRAY, 'Equilibrium Zone', group = ZONES_GROUP)
discountZoneColorInput = input.color( GREEN, 'Discount Zone', group = ZONES_GROUP)
type alerts
bool internalBullishBOS = false
bool internalBearishBOS = false
bool internalBullishCHoCH = false
bool internalBearishCHoCH = false
bool swingBullishBOS = false
bool swingBearishBOS = false
bool swingBullishCHoCH = false
bool swingBearishCHoCH = false
bool internalBullishOrderBlock = false
bool internalBearishOrderBlock = false
bool swingBullishOrderBlock = false
bool swingBearishOrderBlock = false
bool equalHighs = false
bool equalLows = false
bool bullishFairValueGap = false
bool bearishFairValueGap = false
type trailingExtremes
float top
float bottom
int barTime
int barIndex
int lastTopTime
int lastBottomTime
type fairValueGap
float top
float bottom
int bias
box topBox
box bottomBox
type trend
int bias
type equalDisplay
line l_ine = na
label l_abel = na
type pivot
float currentLevel
float lastLevel
bool crossed
int barTime = time
int barIndex = bar_index
type orderBlock
float barHigh
float barLow
int barTime
int bias
// @variable current swing pivot high
var pivot swingHigh = pivot.new(na,na,false)
// @variable current swing pivot low
var pivot swingLow = pivot.new(na,na,false)
// @variable current internal pivot high
var pivot internalHigh = pivot.new(na,na,false)
// @variable current internal pivot low
var pivot internalLow = pivot.new(na,na,false)
// @variable current equal high pivot
var pivot equalHigh = pivot.new(na,na,false)
// @variable current equal low pivot
var pivot equalLow = pivot.new(na,na,false)
// @variable swing trend bias
var trend swingTrend = trend.new(0)
// @variable internal trend bias
var trend internalTrend = trend.new(0)
// @variable equal high display
var equalDisplay equalHighDisplay = equalDisplay.new()
// @variable equal low display
var equalDisplay equalLowDisplay = equalDisplay.new()
// @variable storage for fairValueGap UDTs
var array fairValueGaps = array.new()
// @variable storage for parsed highs
var array parsedHighs = array.new()
// @variable storage for parsed lows
var array parsedLows = array.new()
// @variable storage for raw highs
var array highs = array.new()
// @variable storage for raw lows
var array lows = array.new()
// @variable storage for bar time values
var array times = array.new()
// @variable last trailing swing high and low
var trailingExtremes trailing = trailingExtremes.new()
// @variable storage for orderBlock UDTs (swing order blocks)
var array swingOrderBlocks = array.new()
// @variable storage for orderBlock UDTs (internal order blocks)
var array internalOrderBlocks = array.new()
// @variable storage for swing order blocks boxes
var array swingOrderBlocksBoxes = array.new()
// @variable storage for internal order blocks boxes
var array internalOrderBlocksBoxes = array.new()
// @variable color for swing bullish structures
var swingBullishColor = styleInput == MONOCHROME ? MONO_BULLISH : swingBullColorInput
// @variable color for swing bearish structures
var swingBearishColor = styleInput == MONOCHROME ? MONO_BEARISH : swingBearColorInput
// @variable color for bullish fair value gaps
var fairValueGapBullishColor = styleInput == MONOCHROME ? color.new(MONO_BULLISH,70) : fairValueGapsBullColorInput
// @variable color for bearish fair value gaps
var fairValueGapBearishColor = styleInput == MONOCHROME ? color.new(MONO_BEARISH,70) : fairValueGapsBearColorInput
// @variable color for premium zone
var premiumZoneColor = styleInput == MONOCHROME ? MONO_BEARISH : premiumZoneColorInput
// @variable color for discount zone
var discountZoneColor = styleInput == MONOCHROME ? MONO_BULLISH : discountZoneColorInput
// @variable bar index on current script iteration
varip int currentBarIndex = bar_index
// @variable bar index on last script iteration
varip int lastBarIndex = bar_index
// @variable alerts in current bar
alerts currentAlerts = alerts.new()
// @variable time at start of chart
var initialTime = time
// we create the needed boxes for displaying order blocks at the first execution
if barstate.isfirst
if showSwingOrderBlocksInput
for index = 1 to swingOrderBlocksSizeInput
swingOrderBlocksBoxes.push(box.new(na,na,na,na,xloc = xloc.bar_time,extend = extend.right))
if showInternalOrderBlocksInput
for index = 1 to internalOrderBlocksSizeInput
internalOrderBlocksBoxes.push(box.new(na,na,na,na,xloc = xloc.bar_time,extend = extend.right))
// @variable source to use in bearish order blocks mitigation
bearishOrderBlockMitigationSource = orderBlockMitigationInput == CLOSE ? close : high
// @variable source to use in bullish order blocks mitigation
bullishOrderBlockMitigationSource = orderBlockMitigationInput == CLOSE ? close : low
// @variable default volatility measure
atrMeasure = ta.atr(200)
// @variable parsed volatility measure by user settings
volatilityMeasure = orderBlockFilterInput == ATR ? atrMeasure : ta.cum(ta.tr)/bar_index
// @variable true if current bar is a high volatility bar
highVolatilityBar = (high - low) >= (2 * volatilityMeasure)
// @variable parsed high
parsedHigh = highVolatilityBar ? low : high
// @variable parsed low
parsedLow = highVolatilityBar ? high : low
// we store current values into the arrays at each bar
parsedHighs.push(parsedHigh)
parsedLows.push(parsedLow)
highs.push(high)
lows.push(low)
times.push(time)
leg(int size) =>
var leg = 0
newLegHigh = high > ta.highest( size)
newLegLow = low < ta.lowest( size)
if newLegHigh
leg := BEARISH_LEG
else if newLegLow
leg := BULLISH_LEG
leg
startOfNewLeg(int leg) => ta.change(leg) != 0
startOfBearishLeg(int leg) => ta.change(leg) == -1
startOfBullishLeg(int leg) => ta.change(leg) == +1
drawLabel(int labelTime, float labelPrice, string tag, color labelColor, string labelStyle) =>
var label l_abel = na
if modeInput == PRESENT
l_abel.delete()
l_abel := label.new(chart.point.new(labelTime,na,labelPrice),tag,xloc.bar_time,color=color(na),textcolor=labelColor,style = labelStyle,size = size.small)
drawEqualHighLow(pivot p_ivot, float level, int size, bool equalHigh) =>
equalDisplay e_qualDisplay = equalHigh ? equalHighDisplay : equalLowDisplay
string tag = 'EQL'
color equalColor = swingBullishColor
string labelStyle = label.style_label_up
if equalHigh
tag := 'EQH'
equalColor := swingBearishColor
labelStyle := label.style_label_down
if modeInput == PRESENT
line.delete( e_qualDisplay.l_ine)
label.delete( e_qualDisplay.l_abel)
e_qualDisplay.l_ine := line.new(chart.point.new(p_ivot.barTime,na,p_ivot.currentLevel), chart.point.new(time ,na,level), xloc = xloc.bar_time, color = equalColor, style = line.style_dotted)
labelPosition = math.round(0.5*(p_ivot.barIndex + bar_index - size))
e_qualDisplay.l_abel := label.new(chart.point.new(na,labelPosition,level), tag, xloc.bar_index, color = color(na), textcolor = equalColor, style = labelStyle, size = equalHighsLowsSizeInput)
getCurrentStructure(int size,bool equalHighLow = false, bool internal = false) =>
currentLeg = leg(size)
newPivot = startOfNewLeg(currentLeg)
pivotLow = startOfBullishLeg(currentLeg)
pivotHigh = startOfBearishLeg(currentLeg)
if newPivot
if pivotLow
pivot p_ivot = equalHighLow ? equalLow : internal ? internalLow : swingLow
if equalHighLow and math.abs(p_ivot.currentLevel - low ) < equalHighsLowsThresholdInput * atrMeasure
drawEqualHighLow(p_ivot, low , size, false)
p_ivot.lastLevel := p_ivot.currentLevel
p_ivot.currentLevel := low
p_ivot.crossed := false
p_ivot.barTime := time
p_ivot.barIndex := bar_index
if not equalHighLow and not internal
trailing.bottom := p_ivot.currentLevel
trailing.barTime := p_ivot.barTime
trailing.barIndex := p_ivot.barIndex
trailing.lastBottomTime := p_ivot.barTime
if showSwingsInput and not internal and not equalHighLow
drawLabel(time , p_ivot.currentLevel, p_ivot.currentLevel < p_ivot.lastLevel ? 'LL' : 'HL', swingBullishColor, label.style_label_up)
else
pivot p_ivot = equalHighLow ? equalHigh : internal ? internalHigh : swingHigh
if equalHighLow and math.abs(p_ivot.currentLevel - high ) < equalHighsLowsThresholdInput * atrMeasure
drawEqualHighLow(p_ivot,high ,size,true)
p_ivot.lastLevel := p_ivot.currentLevel
p_ivot.currentLevel := high
p_ivot.crossed := false
p_ivot.barTime := time
p_ivot.barIndex := bar_index
if not equalHighLow and not internal
trailing.top := p_ivot.currentLevel
trailing.barTime := p_ivot.barTime
trailing.barIndex := p_ivot.barIndex
trailing.lastTopTime := p_ivot.barTime
if showSwingsInput and not internal and not equalHighLow
drawLabel(time , p_ivot.currentLevel, p_ivot.currentLevel > p_ivot.lastLevel ? 'HH' : 'LH', swingBearishColor, label.style_label_down)
drawStructure(pivot p_ivot, string tag, color structureColor, string lineStyle, string labelStyle, string labelSize) =>
var line l_ine = line.new(na,na,na,na,xloc = xloc.bar_time)
var label l_abel = label.new(na,na)
if modeInput == PRESENT
l_ine.delete()
l_abel.delete()
l_ine := line.new(chart.point.new(p_ivot.barTime,na,p_ivot.currentLevel), chart.point.new(time,na,p_ivot.currentLevel), xloc.bar_time, color=structureColor, style=lineStyle)
l_abel := label.new(chart.point.new(na,math.round(0.5*(p_ivot.barIndex+bar_index)),p_ivot.currentLevel), tag, xloc.bar_index, color=color(na), textcolor=structureColor, style=labelStyle, size = labelSize)
deleteOrderBlocks(bool internal = false) =>
array orderBlocks = internal ? internalOrderBlocks : swingOrderBlocks
for in orderBlocks
bool crossedOderBlock = false
if bearishOrderBlockMitigationSource > eachOrderBlock.barHigh and eachOrderBlock.bias == BEARISH
crossedOderBlock := true
if internal
currentAlerts.internalBearishOrderBlock := true
else
currentAlerts.swingBearishOrderBlock := true
else if bullishOrderBlockMitigationSource < eachOrderBlock.barLow and eachOrderBlock.bias == BULLISH
crossedOderBlock := true
if internal
currentAlerts.internalBullishOrderBlock := true
else
currentAlerts.swingBullishOrderBlock := true
if crossedOderBlock
orderBlocks.remove(index)
storeOrdeBlock(pivot p_ivot,bool internal = false,int bias) =>
if (not internal and showSwingOrderBlocksInput) or (internal and showInternalOrderBlocksInput)
array a_rray = na
int parsedIndex = na
if bias == BEARISH
a_rray := parsedHighs.slice(p_ivot.barIndex,bar_index)
parsedIndex := p_ivot.barIndex + a_rray.indexof(a_rray.max())
else
a_rray := parsedLows.slice(p_ivot.barIndex,bar_index)
parsedIndex := p_ivot.barIndex + a_rray.indexof(a_rray.min())
orderBlock o_rderBlock = orderBlock.new(parsedHighs.get(parsedIndex), parsedLows.get(parsedIndex), times.get(parsedIndex),bias)
array orderBlocks = internal ? internalOrderBlocks : swingOrderBlocks
if orderBlocks.size() >= 100
orderBlocks.pop()
orderBlocks.unshift(o_rderBlock)
drawOrderBlocks(bool internal = false) =>
array orderBlocks = internal ? internalOrderBlocks : swingOrderBlocks
orderBlocksSize = orderBlocks.size()
if orderBlocksSize > 0
maxOrderBlocks = internal ? internalOrderBlocksSizeInput : swingOrderBlocksSizeInput
array parsedOrdeBlocks = orderBlocks.slice(0, math.min(maxOrderBlocks,orderBlocksSize))
array b_oxes = internal ? internalOrderBlocksBoxes : swingOrderBlocksBoxes
for in parsedOrdeBlocks
orderBlockColor = styleInput == MONOCHROME ? (eachOrderBlock.bias == BEARISH ? color.new(MONO_BEARISH,80) : color.new(MONO_BULLISH,80)) : internal ? (eachOrderBlock.bias == BEARISH ? internalBearishOrderBlockColor : internalBullishOrderBlockColor) : (eachOrderBlock.bias == BEARISH ? swingBearishOrderBlockColor : swingBullishOrderBlockColor)
box b_ox = b_oxes.get(index)
b_ox.set_top_left_point( chart.point.new(eachOrderBlock.barTime,na,eachOrderBlock.barHigh))
b_ox.set_bottom_right_point(chart.point.new(last_bar_time,na,eachOrderBlock.barLow))
b_ox.set_border_color( internal ? na : orderBlockColor)
b_ox.set_bgcolor( orderBlockColor)
displayStructure(bool internal = false) =>
var bullishBar = true
var bearishBar = true
if internalFilterConfluenceInput
bullishBar := high - math.max(close, open) > math.min(close, open - low)
bearishBar := high - math.max(close, open) < math.min(close, open - low)
pivot p_ivot = internal ? internalHigh : swingHigh
trend t_rend = internal ? internalTrend : swingTrend
lineStyle = internal ? line.style_dashed : line.style_solid
labelSize = internal ? internalStructureSize : swingStructureSize
extraCondition = internal ? internalHigh.currentLevel != swingHigh.currentLevel and bullishBar : true
bullishColor = styleInput == MONOCHROME ? MONO_BULLISH : internal ? internalBullColorInput : swingBullColorInput
if ta.crossover(close,p_ivot.currentLevel) and not p_ivot.crossed and extraCondition
string tag = t_rend.bias == BEARISH ? CHOCH : BOS
if internal
currentAlerts.internalBullishCHoCH := tag == CHOCH
currentAlerts.internalBullishBOS := tag == BOS
else
currentAlerts.swingBullishCHoCH := tag == CHOCH
currentAlerts.swingBullishBOS := tag == BOS
p_ivot.crossed := true
t_rend.bias := BULLISH
displayCondition = internal ? showInternalsInput and (showInternalBullInput == ALL or (showInternalBullInput == BOS and tag != CHOCH) or (showInternalBullInput == CHOCH and tag == CHOCH)) : showStructureInput and (showSwingBullInput == ALL or (showSwingBullInput == BOS and tag != CHOCH) or (showSwingBullInput == CHOCH and tag == CHOCH))
if displayCondition
drawStructure(p_ivot,tag,bullishColor,lineStyle,label.style_label_down,labelSize)
if (internal and showInternalOrderBlocksInput) or (not internal and showSwingOrderBlocksInput)
storeOrdeBlock(p_ivot,internal,BULLISH)
p_ivot := internal ? internalLow : swingLow
extraCondition := internal ? internalLow.currentLevel != swingLow.currentLevel and bearishBar : true
bearishColor = styleInput == MONOCHROME ? MONO_BEARISH : internal ? internalBearColorInput : swingBearColorInput
if ta.crossunder(close,p_ivot.currentLevel) and not p_ivot.crossed and extraCondition
string tag = t_rend.bias == BULLISH ? CHOCH : BOS
if internal
currentAlerts.internalBearishCHoCH := tag == CHOCH
currentAlerts.internalBearishBOS := tag == BOS
else
currentAlerts.swingBearishCHoCH := tag == CHOCH
currentAlerts.swingBearishBOS := tag == BOS
p_ivot.crossed := true
t_rend.bias := BEARISH
displayCondition = internal ? showInternalsInput and (showInternalBearInput == ALL or (showInternalBearInput == BOS and tag != CHOCH) or (showInternalBearInput == CHOCH and tag == CHOCH)) : showStructureInput and (showSwingBearInput == ALL or (showSwingBearInput == BOS and tag != CHOCH) or (showSwingBearInput == CHOCH and tag == CHOCH))
if displayCondition
drawStructure(p_ivot,tag,bearishColor,lineStyle,label.style_label_up,labelSize)
if (internal and showInternalOrderBlocksInput) or (not internal and showSwingOrderBlocksInput)
storeOrdeBlock(p_ivot,internal,BEARISH)
fairValueGapBox(leftTime,rightTime,topPrice,bottomPrice,boxColor) => box.new(chart.point.new(leftTime,na,topPrice),chart.point.new(rightTime + fairValueGapsExtendInput * (time-time ),na,bottomPrice), xloc=xloc.bar_time, border_color = boxColor, bgcolor = boxColor)
deleteFairValueGaps() =>
for in fairValueGaps
if (low < eachFairValueGap.bottom and eachFairValueGap.bias == BULLISH) or (high > eachFairValueGap.top and eachFairValueGap.bias == BEARISH)
eachFairValueGap.topBox.delete()
eachFairValueGap.bottomBox.delete()
fairValueGaps.remove(index)
// @function draw fair value gaps
// @returns fairValueGap ID
drawFairValueGaps() =>
= request.security(syminfo.tickerid, fairValueGapsTimeframeInput, [close , open , time , high , low , time , high , low ],lookahead = barmerge.lookahead_on)
barDeltaPercent = (lastClose - lastOpen) / (lastOpen * 100)
newTimeframe = timeframe.change(fairValueGapsTimeframeInput)
threshold = fairValueGapsThresholdInput ? ta.cum(math.abs(newTimeframe ? barDeltaPercent : 0)) / bar_index * 2 : 0
bullishFairValueGap = currentLow > last2High and lastClose > last2High and barDeltaPercent > threshold and newTimeframe
bearishFairValueGap = currentHigh < last2Low and lastClose < last2Low and -barDeltaPercent > threshold and newTimeframe
if bullishFairValueGap
currentAlerts.bullishFairValueGap := true
fairValueGaps.unshift(fairValueGap.new(currentLow,last2High,BULLISH,fairValueGapBox(lastTime,currentTime,currentLow,math.avg(currentLow,last2High),fairValueGapBullishColor),fairValueGapBox(lastTime,currentTime,math.avg(currentLow,last2High),last2High,fairValueGapBullishColor)))
if bearishFairValueGap
currentAlerts.bearishFairValueGap := true
fairValueGaps.unshift(fairValueGap.new(currentHigh,last2Low,BEARISH,fairValueGapBox(lastTime,currentTime,currentHigh,math.avg(currentHigh,last2Low),fairValueGapBearishColor),fairValueGapBox(lastTime,currentTime,math.avg(currentHigh,last2Low),last2Low,fairValueGapBearishColor)))
getStyle(string style) =>
switch style
SOLID => line.style_solid
DASHED => line.style_dashed
DOTTED => line.style_dotted
drawLevels(string timeframe, bool sameTimeframe, string style, color levelColor) =>
= request.security(syminfo.tickerid, timeframe, [high , low , time , time],lookahead = barmerge.lookahead_on)
float parsedTop = sameTimeframe ? high : topLevel
float parsedBottom = sameTimeframe ? low : bottomLevel
int parsedLeftTime = sameTimeframe ? time : leftTime
int parsedRightTime = sameTimeframe ? time : rightTime
int parsedTopTime = time
int parsedBottomTime = time
if not sameTimeframe
int leftIndex = times.binary_search_rightmost(parsedLeftTime)
int rightIndex = times.binary_search_rightmost(parsedRightTime)
array timeArray = times.slice(leftIndex,rightIndex)
array topArray = highs.slice(leftIndex,rightIndex)
array bottomArray = lows.slice(leftIndex,rightIndex)
parsedTopTime := timeArray.size() > 0 ? timeArray.get(topArray.indexof(topArray.max())) : initialTime
parsedBottomTime := timeArray.size() > 0 ? timeArray.get(bottomArray.indexof(bottomArray.min())) : initialTime
var line topLine = line.new(na, na, na, na, xloc = xloc.bar_time, color = levelColor, style = getStyle(style))
var line bottomLine = line.new(na, na, na, na, xloc = xloc.bar_time, color = levelColor, style = getStyle(style))
var label topLabel = label.new(na, na, xloc = xloc.bar_time, text = str.format('P{0}H',timeframe), color=color(na), textcolor = levelColor, size = size.small, style = label.style_label_left)
var label bottomLabel = label.new(na, na, xloc = xloc.bar_time, text = str.format('P{0}L',timeframe), color=color(na), textcolor = levelColor, size = size.small, style = label.style_label_left)
topLine.set_first_point( chart.point.new(parsedTopTime,na,parsedTop))
topLine.set_second_point( chart.point.new(last_bar_time + 20 * (time-time ),na,parsedTop))
topLabel.set_point( chart.point.new(last_bar_time + 20 * (time-time ),na,parsedTop))
bottomLine.set_first_point( chart.point.new(parsedBottomTime,na,parsedBottom))
bottomLine.set_second_point(chart.point.new(last_bar_time + 20 * (time-time ),na,parsedBottom))
bottomLabel.set_point( chart.point.new(last_bar_time + 20 * (time-time ),na,parsedBottom))
higherTimeframe(string timeframe) => timeframe.in_seconds() > timeframe.in_seconds(timeframe)
updateTrailingExtremes() =>
trailing.top := math.max(high,trailing.top)
trailing.lastTopTime := trailing.top == high ? time : trailing.lastTopTime
trailing.bottom := math.min(low,trailing.bottom)
trailing.lastBottomTime := trailing.bottom == low ? time : trailing.lastBottomTime
drawHighLowSwings() =>
var line topLine = line.new(na, na, na, na, color = swingBearishColor, xloc = xloc.bar_time)
var line bottomLine = line.new(na, na, na, na, color = swingBullishColor, xloc = xloc.bar_time)
var label topLabel = label.new(na, na, color=color(na), textcolor = swingBearishColor, xloc = xloc.bar_time, style = label.style_label_down, size = size.tiny)
var label bottomLabel = label.new(na, na, color=color(na), textcolor = swingBullishColor, xloc = xloc.bar_time, style = label.style_label_up, size = size.tiny)
rightTimeBar = last_bar_time + 20 * (time - time )
topLine.set_first_point( chart.point.new(trailing.lastTopTime, na, trailing.top))
topLine.set_second_point( chart.point.new(rightTimeBar, na, trailing.top))
topLabel.set_point( chart.point.new(rightTimeBar, na, trailing.top))
topLabel.set_text( swingTrend.bias == BEARISH ? 'Strong High' : 'Weak High')
bottomLine.set_first_point( chart.point.new(trailing.lastBottomTime, na, trailing.bottom))
bottomLine.set_second_point(chart.point.new(rightTimeBar, na, trailing.bottom))
bottomLabel.set_point( chart.point.new(rightTimeBar, na, trailing.bottom))
bottomLabel.set_text( swingTrend.bias == BULLISH ? 'Strong Low' : 'Weak Low')
drawZone(float labelLevel, int labelIndex, float top, float bottom, string tag, color zoneColor, string style) =>
var label l_abel = label.new(na,na,text = tag, color=color(na),textcolor = zoneColor, style = style, size = size.small)
var box b_ox = box.new(na,na,na,na,bgcolor = color.new(zoneColor,80),border_color = color(na), xloc = xloc.bar_time)
b_ox.set_top_left_point( chart.point.new(trailing.barTime,na,top))
b_ox.set_bottom_right_point(chart.point.new(last_bar_time,na,bottom))
l_abel.set_point( chart.point.new(na,labelIndex,labelLevel))
// @function draw premium/discount zones
// @returns void
drawPremiumDiscountZones() =>
drawZone(trailing.top, math.round(0.5*(trailing.barIndex + last_bar_index)), trailing.top, 0.95*trailing.top + 0.05*trailing.bottom, 'Premium', premiumZoneColor, label.style_label_down)
equilibriumLevel = math.avg(trailing.top, trailing.bottom)
drawZone(equilibriumLevel, last_bar_index, 0.525*trailing.top + 0.475*trailing.bottom, 0.525*trailing.bottom + 0.475*trailing.top, 'Equilibrium', equilibriumZoneColorInput, label.style_label_left)
drawZone(trailing.bottom, math.round(0.5*(trailing.barIndex + last_bar_index)), 0.95*trailing.bottom + 0.05*trailing.top, trailing.bottom, 'Discount', discountZoneColor, label.style_label_up)
parsedOpen = showTrendInput ? open : na
candleColor = internalTrend.bias == BULLISH ? swingBullishColor : swingBearishColor
plotcandle(parsedOpen,high,low,close,color = candleColor, wickcolor = candleColor, bordercolor = candleColor)
if showHighLowSwingsInput or showPremiumDiscountZonesInput
updateTrailingExtremes()
if showHighLowSwingsInput
drawHighLowSwings()
if showPremiumDiscountZonesInput
drawPremiumDiscountZones()
if showFairValueGapsInput
deleteFairValueGaps()
getCurrentStructure(swingsLengthInput,false)
getCurrentStructure(5,false,true)
if showEqualHighsLowsInput
getCurrentStructure(equalHighsLowsLengthInput,true)
if showInternalsInput or showInternalOrderBlocksInput or showTrendInput
displayStructure(true)
if showStructureInput or showSwingOrderBlocksInput or showHighLowSwingsInput
displayStructure()
if showInternalOrderBlocksInput
deleteOrderBlocks(true)
if showSwingOrderBlocksInput
deleteOrderBlocks()
if showFairValueGapsInput
drawFairValueGaps()
if barstate.islastconfirmedhistory or barstate.islast
if showInternalOrderBlocksInput
drawOrderBlocks(true)
if showSwingOrderBlocksInput
drawOrderBlocks()
lastBarIndex := currentBarIndex
currentBarIndex := bar_index
newBar = currentBarIndex != lastBarIndex
if barstate.islastconfirmedhistory or (barstate.isrealtime and newBar)
if showDailyLevelsInput and not higherTimeframe('D')
drawLevels('D',timeframe.isdaily,dailyLevelsStyleInput,dailyLevelsColorInput)
if showWeeklyLevelsInput and not higherTimeframe('W')
drawLevels('W',timeframe.isweekly,weeklyLevelsStyleInput,weeklyLevelsColorInput)
if showMonthlyLevelsInput and not higherTimeframe('M')
drawLevels('M',timeframe.ismonthly,monthlyLevelsStyleInput,monthlyLevelsColorInput)
xATR = ta.atr(c)
nLoss = a * xATR
src = h ? request.security(ticker.heikinashi(syminfo.tickerid), timeframe.period, close, lookahead = barmerge.lookahead_off) : close
xATRTrailingStop = 0.0
iff_1 = src > nz(xATRTrailingStop , 0) ? src - nLoss : src + nLoss
iff_2 = src < nz(xATRTrailingStop , 0) and src < nz(xATRTrailingStop , 0) ? math.min(nz(xATRTrailingStop ), src + nLoss) : iff_1
xATRTrailingStop := src > nz(xATRTrailingStop , 0) and src > nz(xATRTrailingStop , 0) ? math.max(nz(xATRTrailingStop ), src - nLoss) : iff_2
pos = 0
iff_3 = src > nz(xATRTrailingStop , 0) and src < nz(xATRTrailingStop , 0) ? -1 : nz(pos , 0)
pos := src < nz(xATRTrailingStop , 0) and src > nz(xATRTrailingStop , 0) ? 1 : iff_3
xcolor = pos == -1 ? color.red : pos == 1 ? color.green : color.blue
ema = ta.ema(src, 1)
above = ta.crossover(ema, xATRTrailingStop)
below = ta.crossover(xATRTrailingStop, ema)
buy = src > xATRTrailingStop and above
sell = src < xATRTrailingStop and below
barbuy = src > xATRTrailingStop
barsell = src < xATRTrailingStop
//---------------------------------------------------------------------------------------------------------------------}
//ALERTS
//---------------------------------------------------------------------------------------------------------------------{
alertcondition(currentAlerts.internalBullishBOS, 'Internal Bullish BOS', 'Internal Bullish BOS formed')
alertcondition(currentAlerts.internalBullishCHoCH, 'Internal Bullish CHoCH', 'Internal Bullish CHoCH formed')
alertcondition(currentAlerts.internalBearishBOS, 'Internal Bearish BOS', 'Internal Bearish BOS formed')
alertcondition(currentAlerts.internalBearishCHoCH, 'Internal Bearish CHoCH', 'Internal Bearish CHoCH formed')
alertcondition(currentAlerts.swingBullishBOS, 'Bullish BOS', 'Internal Bullish BOS formed')
alertcondition(currentAlerts.swingBullishCHoCH, 'Bullish CHoCH', 'Internal Bullish CHoCH formed')
alertcondition(currentAlerts.swingBearishBOS, 'Bearish BOS', 'Bearish BOS formed')
alertcondition(currentAlerts.swingBearishCHoCH, 'Bearish CHoCH', 'Bearish CHoCH formed')
alertcondition(currentAlerts.internalBullishOrderBlock, 'Bullish Internal OB Breakout', 'Price broke bullish internal OB')
alertcondition(currentAlerts.internalBearishOrderBlock, 'Bearish Internal OB Breakout', 'Price broke bearish internal OB')
alertcondition(currentAlerts.swingBullishOrderBlock, 'Bullish Swing OB Breakout', 'Price broke bullish swing OB')
alertcondition(currentAlerts.swingBearishOrderBlock, 'Bearish Swing OB Breakout', 'Price broke bearish swing OB')
alertcondition(currentAlerts.equalHighs, 'Equal Highs', 'Equal highs detected')
alertcondition(currentAlerts.equalLows, 'Equal Lows', 'Equal lows detected')
alertcondition(currentAlerts.bullishFairValueGap, 'Bullish FVG', 'Bullish FVG formed')
alertcondition(currentAlerts.bearishFairValueGap, 'Bearish FVG', 'Bearish FVG formed')
alertcondition(buy, 'UT Long', 'UT Long')
alertcondition(sell, 'UT Short', 'UT Short')
plotshape(buy, title = 'Buy', text = 'Buy', style = shape.labelup, location = location.belowbar, color = color.new(color.green, 0), textcolor = color.new(color.white, 0), size = size.tiny)
plotshape(sell, title = 'Sell', text = 'Sell', style = shape.labeldown, location = location.abovebar, color = color.new(color.red, 0), textcolor = color.new(color.white, 0), size = size.tiny)
//--------------------------------------------------------------------------------------
// EMA ADDITIONS (Editable)
//--------------------------------------------------------------------------------------
ema5Len = input.int(5, "5 EMA Length", minval = 1)
ema9Len = input.int(9, "9 EMA Length", minval = 1)
ema5 = ta.ema(src, ema5Len)
ema9 = ta.ema(src, ema9Len)
plot(ema5, "EMA 5", color = color.red, linewidth = 2)
plot(ema9, "EMA 9", color = color.blue, linewidth = 2)
barcolor(barbuy ? color.green : na)
barcolor(barsell ? color.red : na)

ALMA & EMA Ribbon by zdmreThis indicator combines a unique trend-following signal with a classic EMA ribbon to provide a clear view of the market trend.
The main signal line is not based on a typical ATR. Instead, it uses an Arnaud Legoux Moving Average (ALMA) as its baseline and calculates support/resistance bands using Standard Deviation. This creates a responsive trend line that adapts well to volatility. This is paired with a simple EMA Ribbon to help confirm momentum.
What It Does
ALMA + SD Trend Line: This is the core of the indicator. It uses an ALMA as the baseline (instead of a simple MA) and Standard Deviation for the bands. This tends to be more responsive than many traditional trend-following indicators.
Buy/Sell Signals: Simple "B" and "S" labels appear on your chart when the trend is calculated to have changed direction.
EMA Ribbon: A standard Fast/Slow EMA ribbon is plotted to give you a secondary confirmation of momentum. The fill between the EMAs changes color (green for bull, red for bear).
On-Screen Dashboard: A clean info panel in the corner shows you the current status of all components at a glance:
Current Signal (Long/Short)
Price vs. Trend Line (Above/Below)
Trend Strength (%)
EMA Trend (Bullish/Bearish)
Momentum
Fully Customizable: You can toggle every visual element on or off (the signals, the ribbon, the bar coloring, the dashboard) to keep your chart clean.
Settings
Trend Settings:
Factor: This is the main setting. It's the Standard Deviation multiplier. A higher value makes the line less sensitive (fewer signals). A lower value makes it more sensitive (more signals).
SD Length: The lookback for the Standard Deviation.
ALMA Settings:
ALMA Length, Sigma, Offset: Standard controls for the ALMA's smoothness and responsiveness.
EMA Ribbon:
Fast EMA & Slow EMA: Set the lengths for your ribbon.
Visual Settings:
Checkboxes to toggle all visual components (signals, ribbon, dashboard, etc.).
You can set up alerts in TradingView for the following events:
🟢 Long Signal: Triggers on a new "B" (Buy) signal.
🔴 Short Signal: Triggers on a new "S" (Sell) signal.
⚠️ Price Crossed Trend: Triggers any time the price closes across the main trend line.
#DYOR

EMA Regime (9/20/50/100/200) — Stacked with 200 FilterEMA Regime (9/20/50/100/200) — Stacked Long/Short Box
Plots the 9, 20, 50, 100, and 200 EMAs on the chart.
Checks if price is above or below each EMA and whether the EMAs are stacked in order.
LONG signal: price above all selected EMAs and EMAs stacked 9 > 20 > 50 > 100 >(> 200 if strict mode on).
SHORT signal: price below all selected EMAs and EMAs stacked 9 < 20 < 50 < 100 (< 200 if strict mode on).
Shows a two-row table (LONGS / SHORTS) so you can quickly see which EMAs are aligned.
Optionally colors candles green/red when a full long/short regime is active.
Can show labels when a new LONG or SHORT condition appears.
Has alerts you can use for automated notifications when the regime flips.
“Use 200 EMA in the stack” lets you choose ultra-strict mode (9>20>50>100>200) or lighter mode (9>20>50>100 but price & 9 above 200).

EMA ± ATR Channel (True Range)EMA ± ATR Channel (True Range)
Tagline: Adaptive EMA channel with ATR-based volatility bands — perfect for swing trading, intraday setups, and managing risk on high-volatility stocks.
This script plots a dynamic price channel around a configurable EMA using the Average True Range (ATR, Wilder’s True Range) as a volatility buffer.
Upper band = EMA + (ATR × multiplier)
Lower band = EMA – (ATR × multiplier)
📊 Features:
Adjustable EMA length, ATR length, and ATR multiplier
Visual channel fill between upper and lower bands
Optional on-chart help panel with practical combos
⚡ Practical Combos for Volatile Stocks:
EMA 20 + ATR 14 × 2.0 → most common swing trading setup
EMA 10 + ATR 14 × 1.5 → very responsive, good for intraday/high-beta names
EMA 20 + ATR 20 × 2.5 → smoother, wider channel, avoids whipsaws in chaotic stocks
✅ Use cases:
Identify dynamic support/resistance zones
Volatility-based stop-loss & take-profit placement
Spot overextensions from the trend midline
🔖 Tags:
ema, atr, channel, volatility, trend, support resistance, stop loss, swing trading, intraday, risk management, indicator
